
Are we on plan?
See total delivery, pacing, remaining inventory and the campaigns that need attention before the reporting deadline.
Give clients a clear view of delivery, audience and performance while keeping account leads out of routine export requests. Podrelay maintains your podcast analytics dashboard using checked source data, with campaign results and commercial context in one branded view.
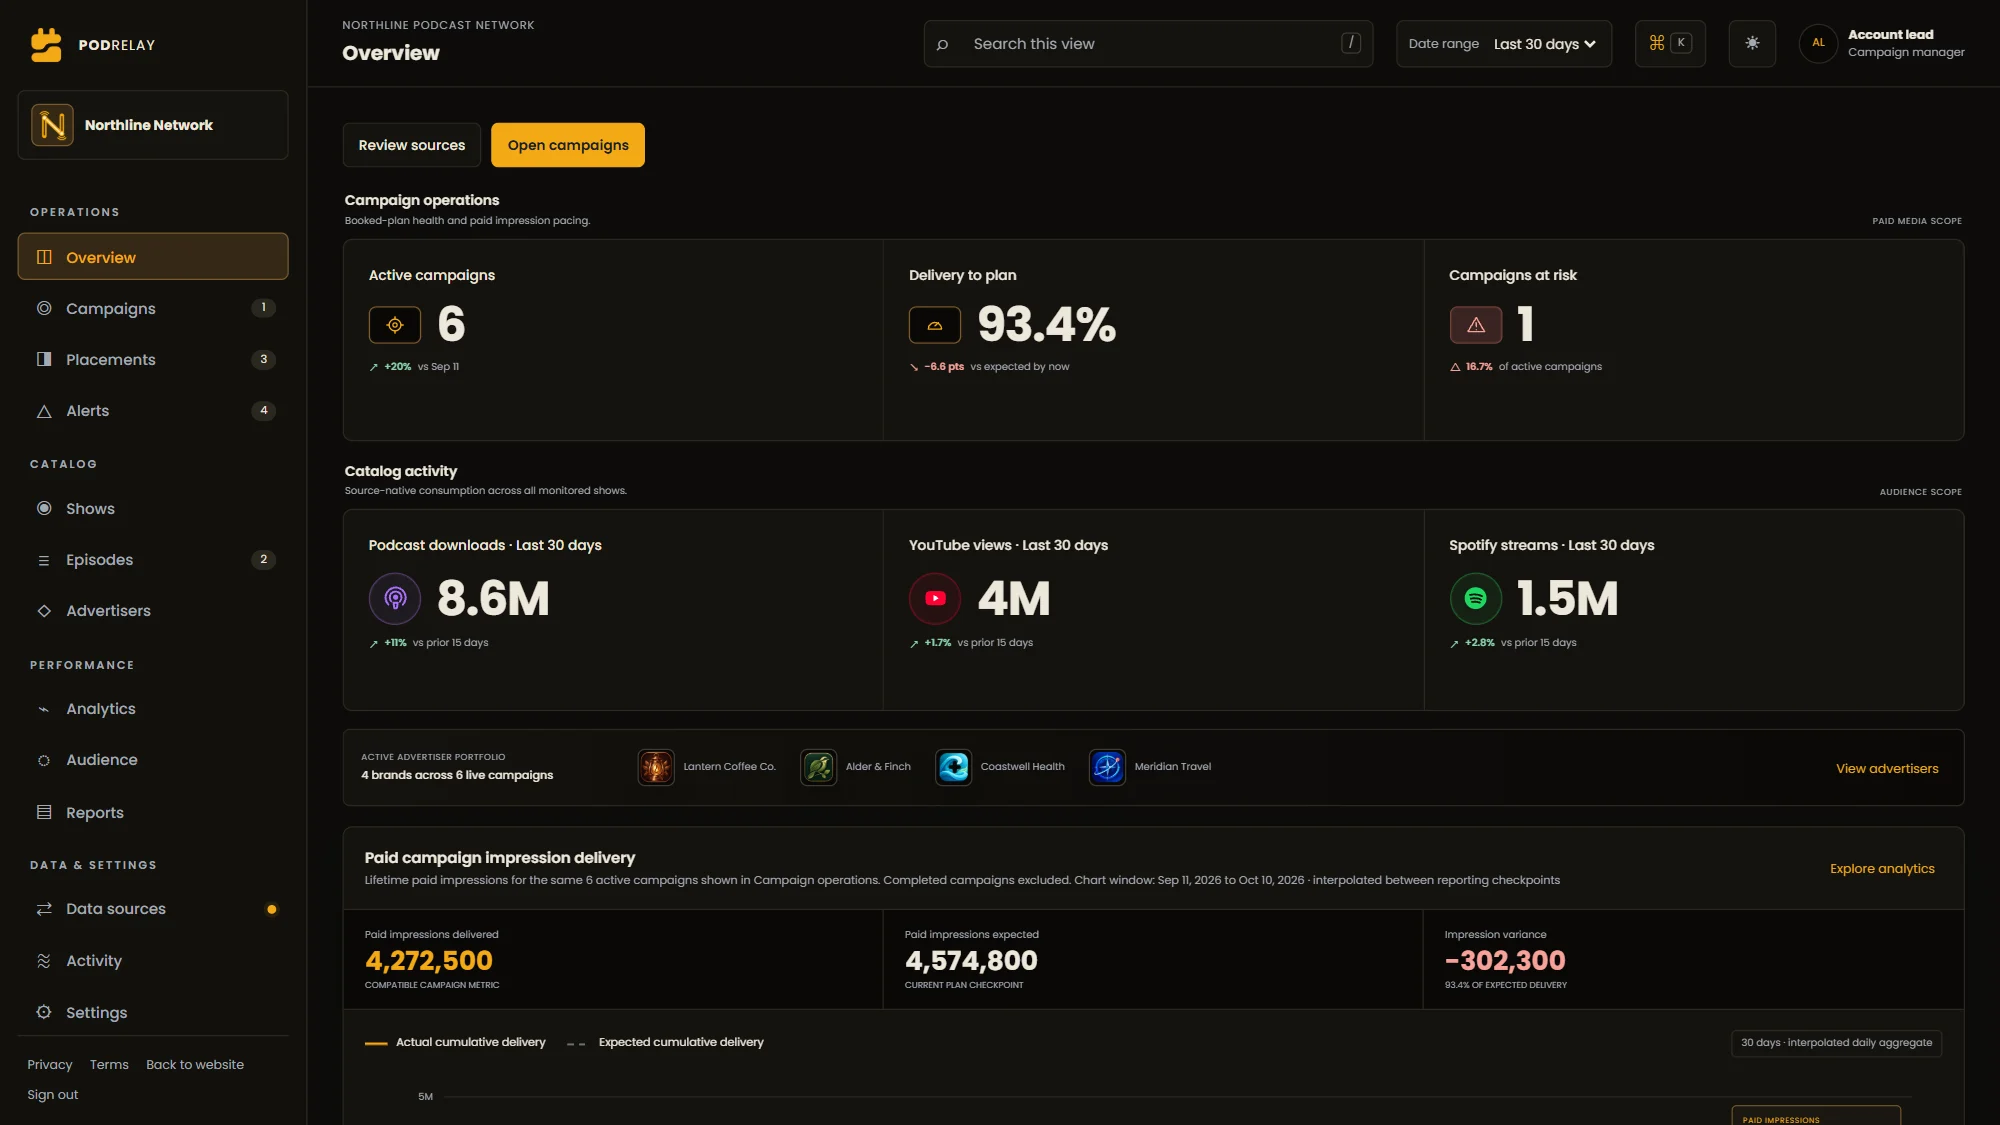
See delivery gaps, audience response and commercial results with the metrics that answer each question. Give account teams a clear basis for campaign changes and renewal conversations.
See total delivery, pacing, remaining inventory and the campaigns that need attention before the reporting deadline.
Keep podcast downloads, YouTube views and engaged views, streams and conversions inside the correct platform context.
Connect spend, attributed revenue, efficiency and a concise decision brief without turning the dashboard into a spreadsheet.
Podrelay can bring available audience geography, age, gender, device mix and engagement trends into one maintained view across your shows. Every audience breakdown stays attached to the platform, time window and coverage it came from. Where a platform does not provide a field, the dashboard records that limit.
Compare show performance using equivalent reporting periods and episode ages. A first-week release should not be compared with a catalog episode's lifetime total. Downloads, streams and video views remain separate measures; combining their dashboards does not prove how many unique people listened across platforms.
This gives account teams a clearer basis for audience profiles, show recommendations and campaign planning. The podcast audience analytics guide explains the comparison rules and includes a worked example.
A polished chart is dangerous when the metrics underneath it do not share a definition. Every view should define what the total represents, show how each platform contributes to it and keep engagement and conversion separate so the figures reconcile.
Track YouTube views and engaged views separately, alongside watch time and retention. YouTube counts engaged views when viewing continues beyond the opening frame or someone actively starts playback. We use the platform's metric definition and report it within its source context. An engaged view does not confirm that a sponsor's ad was seen.
The public example uses fictional figures. A live build is defined around the agency's agreed sources, reporting periods and client language.
The dashboard can use client-authorized platform-native data from hosting, YouTube, Spotify, Apple Podcasts and ad-serving systems, then combine it with commercial records and approved attribution outputs. Those systems remain the sources of record. Podrelay normalizes their definitions and preserves the source behind each figure instead of pretending every metric was measured the same way.
No Podrelay listener-tracking pixel or podcast prefix is required. When attribution appears, it comes from the measurement source the client selected and is labeled with the relevant model, window and reporting context.
A dashboard bought as a standalone tool tends to drift from the reports your team sends, because two surfaces built by two processes eventually disagree. Then a client puts them side by side and the conversation stops being about performance.
Here the dashboard comes with Reporting + dashboard, on top of the full reporting operation, and draws on the same reconciled figures and the same agreed metric definitions as your scheduled reports and QBR decks. Same data, same definitions, different surface, so the numbers always match.
These are working reporting environments built for active podcast operations. Client identities and exact commercial results are blurred; the information architecture, charting and reporting workflows are real.
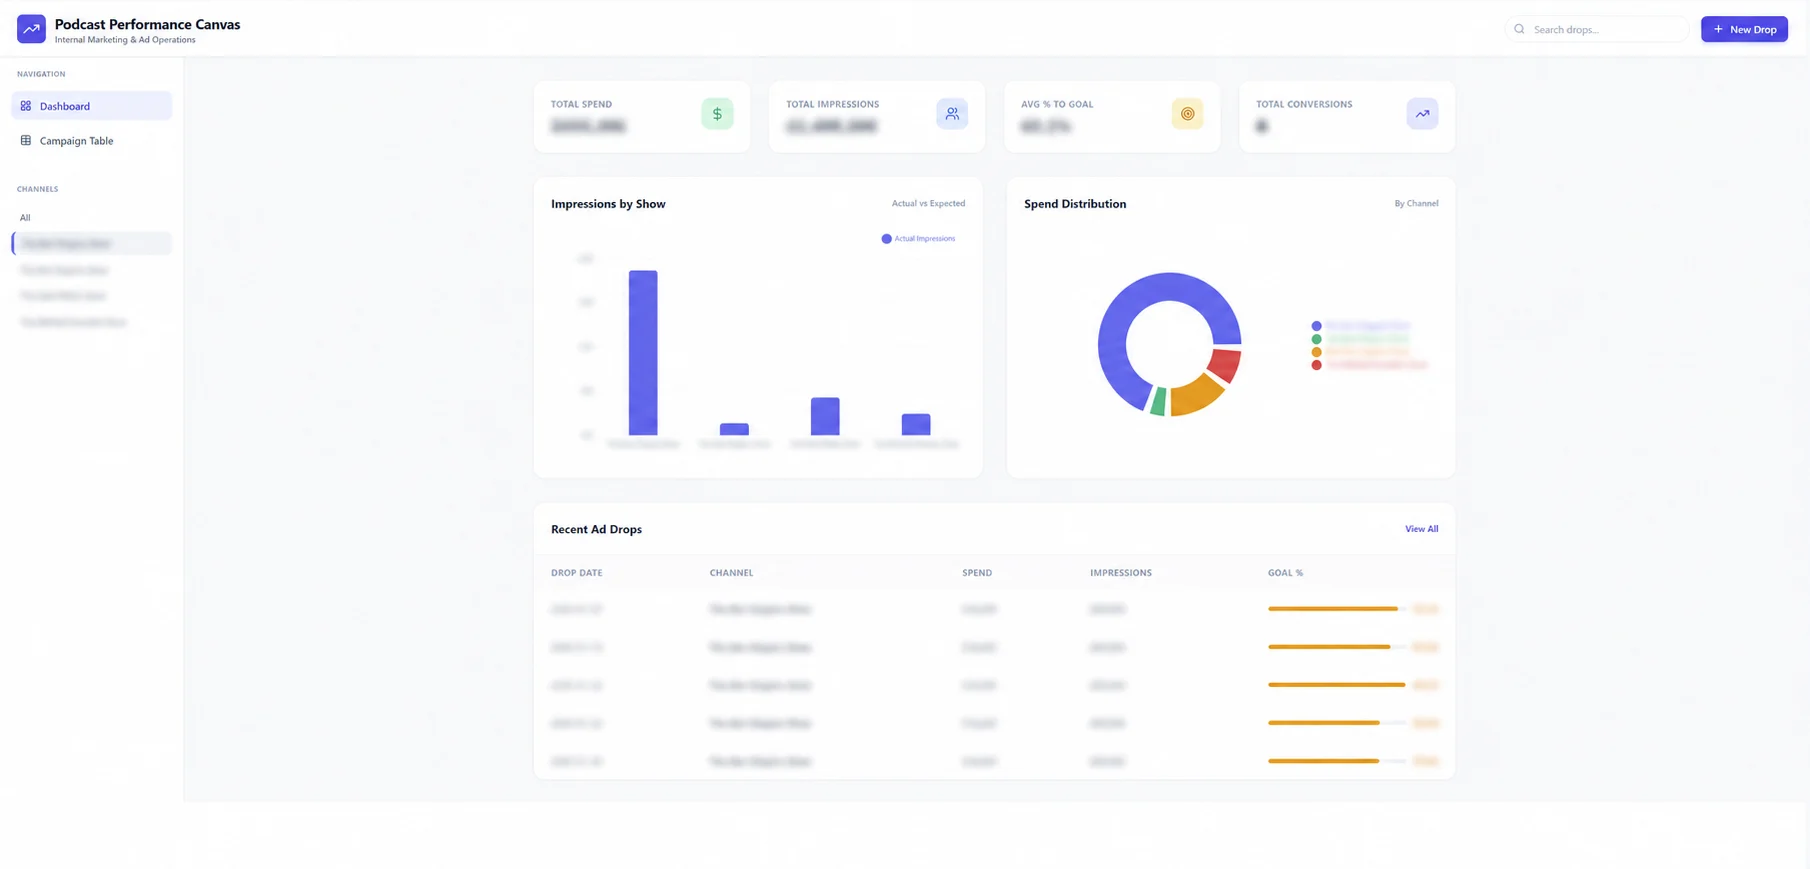
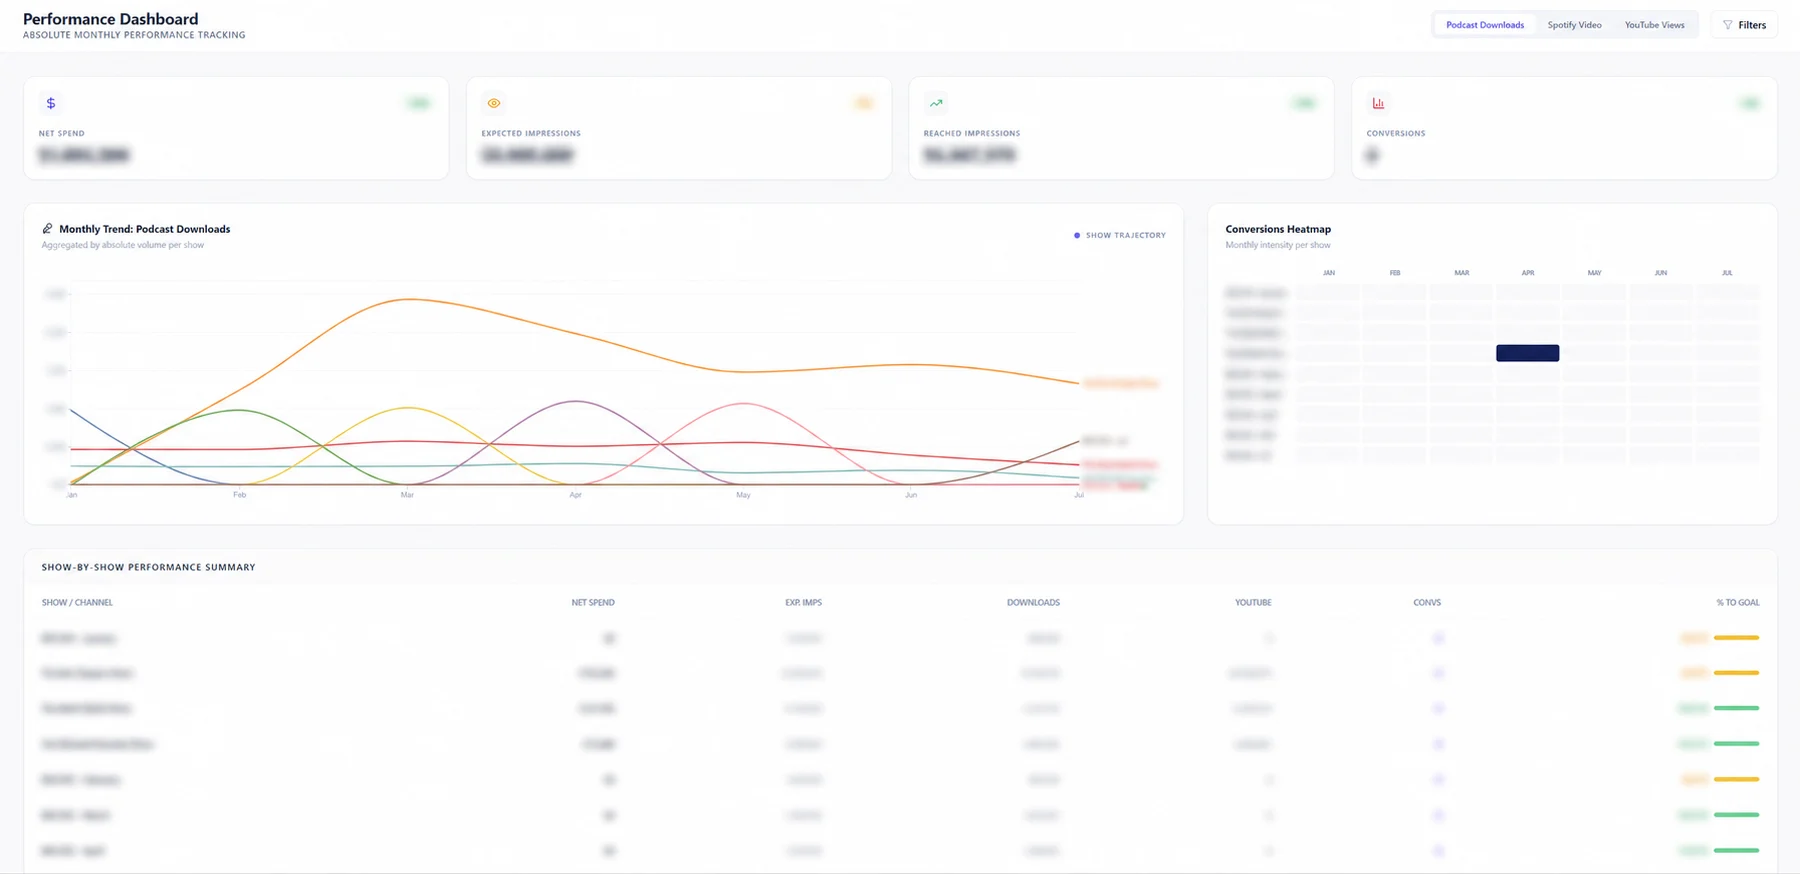
Yes. Podrelay can organize available audience geography, demographics, device mix and engagement metrics from client-authorized platforms in one reporting view. Fields depend on each source and its access permissions. Missing demographics remain unavailable rather than being inferred.
Yes, using consistent reporting periods and the metrics available for each show. Comparisons retain platform labels, episode age and refresh context so a download, stream or video view is interpreted under its own definition.
Centralizing data does not establish unique people across Apple Podcasts, Spotify, YouTube and hosting platforms. Podrelay keeps platform-specific audience figures separate unless an authorized measurement source provides a documented deduplication method.
It should connect campaign delivery, podcast and video consumption, conversions, commercial efficiency and exceptions using definitions the agency and client agree on.
Yes. Podrelay can connect directly to client-authorized platform data or use approved exports and shared workspaces. Hosting, distribution, ad-serving, sales and attribution systems remain the sources of record; the dashboard is the maintained reporting view above them.
Yes. Views can be structured around the campaigns, advertisers and reporting periods each audience is permitted to see.
Not always. The dashboard provides an always-current operating view, while scheduled reports can preserve a period-specific narrative, approval record or executive summary.
No. The dashboard comes with Reporting + dashboard, on top of the full reporting operation, and is not sold on its own. The same reconciled data that produces your scheduled client reports feeds the dashboard, which is what keeps the two consistent.
No. Podrelay does not need its own listener-tracking pixel or podcast prefix to build the reporting view. Attribution results can come from a measurement provider the client already uses, while platform-native delivery and consumption metrics come from the authorized source systems.
The implementation may keep data in client-controlled tools or place the required fields in a client-approved reporting workspace. The approved locations, access permissions, retention and deletion process are documented before launch. Public dashboard examples contain fictional or sanitized data only.
Podrelay uses data minimization and requests only the fields and permissions needed for the agreed dashboard. The service is designed around aggregated campaign and platform metrics rather than identifying individual listeners. Where personal data is processed on a client's documented instructions, the parties define their roles and enter into a Data Processing Agreement when required. Security, confidentiality, subprocessors, international transfers, incident handling, retention and return or deletion are addressed in the applicable agreement.
Bring the questions clients keep asking. We'll map which figures belong in their view and how to keep that view useful between reports.
Book a reviewWe reply within one business day.